Behavior is everything that we, as people, do — including when we’re researching sports betting models. Behavior analysis is understanding WHY we do what we do.
Whether it is individuals or groups of people, there are many variables in our environment that impact our behavior and how we respond to certain things. Sports are no different. Players and coaches try everything they can to control the environment around them to produce optimal outcomes. They do this to ensure optimal outcomes.
Sports betting is also no different in terms of how bettors take into account the different behaviors of players or teams before placing their bets. Bettors typically place bets when they have the greatest understanding of all of the different variables that could impact the environment of a particular game.
To do this, bettors often look to analysts (like the great ones here at Pro Football Network) for valuable information and trends that could affect the outcome of a game. Bettors also seek out sports betting models for projections and predictions that have strong correlations with actual outcomes.
What Is a Sports Betting Model?
Sports betting models take into account an incredible amount of data points relative to the outcome they are trying to project. Likewise, some betting models only select specific data points that align with what they believe to be most valuable to the outcome they are trying to project. In football, for example, those data points could be things such as yards gained, yards given up, penalties, starting field position, points scored, dewpoint at kickoff, etc.
Those who create models attempt to place relevant values on those data points to dial in their model at a level of accuracy suitable for them to make confident predictions. As a behaviorist, I attempt to pinpoint specific team behaviors as data points to include in my model. Things like points scored and points given up, among other things.
I use these points to project winners against the spread (ATS), over/unders, etc. You can follow my model’s success every week by following me on Pikkit. Pikkit is a community for bettors to interact around the bets they place, as well as my favorite bet tracking app out there, so everyone can see how I’m doing.
Using Behavior Analysis To Help in Sports Betting
Applied Behavior Analysis (ABA) is often incorrectly exclusively associated with a therapy model for individuals with Autism. However, behavior analysis is a hard science based on collecting observable events, charting that data, and searching for trends that lead to projections of future behavior.
Sound familiar?
As a behaviorist and the creator of these metrics for my company The Behavior Movement, I work directly with many NFL players on technique and movement behavior for their positions. Additionally, I observe the team behaviors of all 32 teams in all 32 different environments they operate in on a weekly basis. Some of those behaviors are more valuable than others in determining winners and losers.
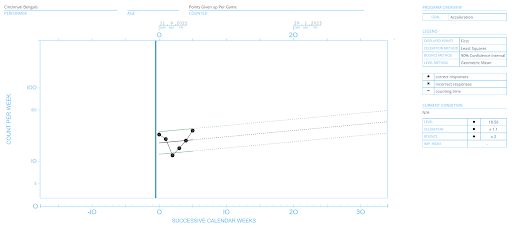
I’ve taken the data collected in my observations and put them in a model using a Standard Celeration Chart (SCC), which is a logarithmic chart measuring the speed at which something is getting better or worse.
This model gives me projections for expected behaviors of the teams in a few different areas that I use to bet against the spread, the moneyline, over/unders, and even some parlays. I even use this for some fantasy projections that I play at Underdog Fantasy. I love the lineup feel of the plays and combining certain projections into big payouts. All of it is predicated on the principles of behavior analysis.

This is a chart of six weeks’ worth of Cincinnati Bengals’ data on how many points they have allowed per game as a team. What this chart shows is how fast their team is accelerating in giving up more points (not good for a defense), the likely range of outcomes indicated by the green “bounce” lines, and the average, or level, of this data.
Explaining Level, Celeration, and Bounce
Adhering to principles of applied behavior analysis partly means knowing what it is we are looking at when we analyze trends, projections, and expected outcomes. It is very important that we know the definitions of key terminology being used, not just for the person doing the modeling but perhaps even more importantly for you, the audience.
Below are three key terms to know when analyzing the chart above:
Level
Level on these charts simply refers to the average of the data points consumed. This does not indicate trends or projections but is simply an average of the data cumulatively. While helpful to know, this doesn’t tell us how fast or slow something is getting better or worse. Likewise, it does not factor into the actual predictions of scores but may play a role in over/unders.
Celeration
When you see celeration on these charts, think acceleration or deceleration. Simply, celeration refers to the speed something is growing (getting better) or decaying (getting worse). This is represented by a multiple (x1.1) or a divisor (÷2). Visually on the chart, this is the solid and dotted black line. We use this as one part of what makes a projection or prediction.
Bounce
Bounce is exactly what it sounds like. It is the “bounciness” of the data. Think of a basketball being dribbled. Bigger distances between two data points is a big bounce, smaller distances is a small bounce. Bounce rate is the representation of the consistency of the data. The more small bounces there are, the smaller the bounce rate, the more consistent the data, the more confidence there is in the projection.
The opposite is true when it comes to bigger bounces. On the chart, this is always represented in multiples (x2). Visually on the chart, this is the solid and dotted green lines. They represent the high and low ends of the range of outcomes. The celeration line will always split the bounce rate.
If you are to consume this information and then place a bet on the Barstool sportsbook app with a promo because you liked what you saw, it is very important you understand what it is you are looking at.
Up doesn’t always mean good, and down doesn’t always mean bad!
Frequently Asked Questions
Can you use this model to bet every single game played?
The short answer is yes. However, remember the bounce rate. I personally will not place a wager on a game where a team has a bounce rate over x3 or if a team has a celeration in either direction over 2. This indicates high levels of chaos and outlier possibilities. If you follow me on pikkit, I will always say which games I am betting on and what those numbers are as to how I selected those specific games. If I deviate from that, I’ll always be transparent about that.
What does a 90% confidence level for Bounce Rate mean on the chart?
This represents how “confident” we are in calculating this particular bounce rate. 90% is the standard for calculating a bounce rate, meaning that we are 90% confident that this is the correct range of outcomes for a projection. Anything that came in outside that range would be considered an outlier.

