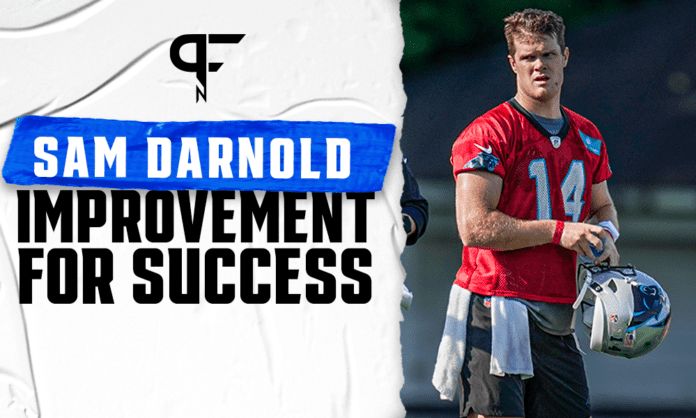
It’s safe to say that the Carolina Panthers’ new quarterback, Sam Darnold, wasn’t the savior the New York Jets were hoping for. That’s why he found himself replaced in the 2021 NFL Draft and traded away to Carolina. The question is, can Darnold turn his career around in a new city, or has the chance to be an elite starting quarterback at the NFL level already passed him by?
It’s not hard to see why the Jets let Sam Darnold go
If you want to understand why New York decided to move on from Darnold, the only evidence you should need are his box score statistics, which you can see in the chart below.
| Passing Yards | Passing Touchdowns | Interceptions | |
| 2018 | 2,865 | 17 | 15 |
| 2019 | 3,024 | 19 | 13 |
| 2020 | 2,208 | 9 | 11 |
Clearly, Darnold’s rookie season wasn’t particularly encouraging. It’s not the worst season anyone’s ever had, but it’s safe to say that Darnold wasn’t in any danger of winning Offensive Rookie of the Year.
In fairness to Darnold, not every NFL star excels during their first season. And to his credit, he did improve somewhat during his second year in the league, giving fans some hope that he might yet become an elite signal-caller.
Unfortunately, everything went off the rails during his final year in New York. Darnold had the worst statistical campaign of his short career, and the Jets won just two games.
Darnold’s personal struggles, combined with the team’s overall failings, led to the Jets front office embarking on a complete rebuild, acquiring a new starting QB and head coach during the offseason.
Advanced metrics aren’t any better
To better understand Darnold’s many failings and determine what he might be able to provide to the Panthers’ offense, we can’t just look at his traditional statistics. We also need to examine his advanced metrics.
Let’s start with the Offensive Value Metric (OVM). The OVM is a grading system created by the (Bx) Movement to evaluate players based on how much they contributed to the creation of their statistics, rather than the statistics themselves.
Unfortunately, Darnold didn’t fare any better on this metric than he did on the more traditional ones. During his rookie year, he received a grade of 22.32, which ranked 24th among all qualifying quarterbacks.
Despite his box score improving in 2019, Darnold’s OVM grade fell slightly, dropping to 22.01. Although, thanks to the overall level of quarterback play declining, he ranked marginally better, at 19th.
Those two grades were slightly below average. That’s not particularly encouraging, but you might think it wasn’t time to give up on him just yet.
However, last season was a complete disaster. His grade nosedived to just 16.27, the third-lowest of any qualifying quarterback, indicating that he contributed basically nothing to his offense.
Examining weekly OVM grades
For a more in-depth examination of Darnold’s OVM performances, let’s look at how he performed on a weekly basis.
The charts below show every weekly grade he has received during his NFL career, marked by the black dots. For comparison, the league average OVM grades for quarterbacks from those seasons are marked by the yellow lines.
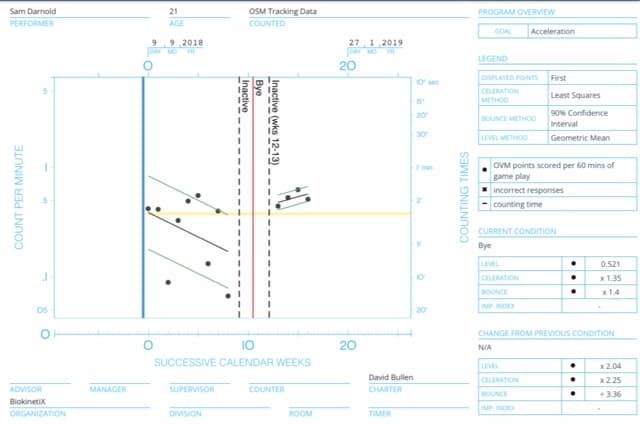
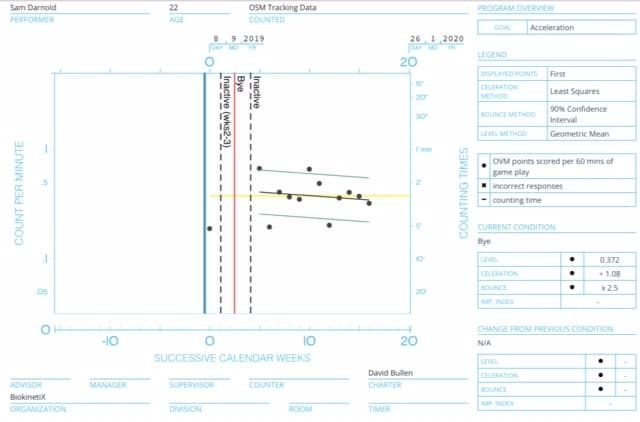
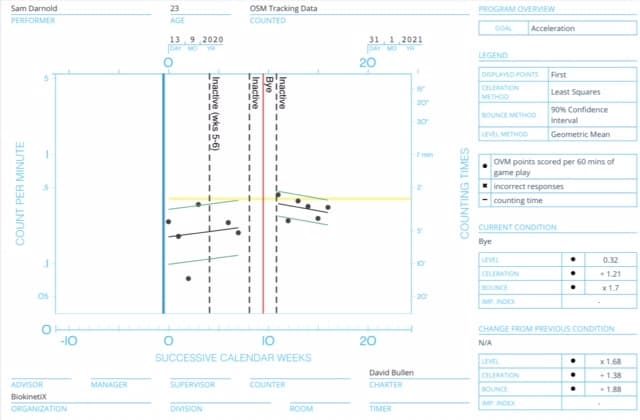
Throughout his career, Darnold has been consistently inconsistent. During his first two seasons, he has several grades well above the league average and many far below it.
In 2020, he was similarly inconsistent, but the range of his grades shifted down so far that almost all of his grades were below the league average. His best grade, and the only one even slightly above the average, was just 25.52.
Examining the advanced metrics behind Darnold’s OVM grades
To fully grasp why the Jets decided to move on from Darnold, we need to explore the advanced metrics involved in calculating his OVM grades.
As you likely suspect, given his poor performances on the metric, the numbers aren’t great, especially last season.
The chart below shows how Darnold performed on the following statistics over the last three years:
- His average air yards on all of his pass attempts (IAY)
- His average air yards on his completions (CAY)
- How often he threw into tight windows (AGG%)
- His completion percentage
- The completion percentage he was expected to have according to the NFL’s advanced metrics
| IAY | CAY | AGG% | COMP% | eCOMP% | |
| 2018 | 9.4 | 6.5 | 19.6 | 57.7 | 60.4 |
| 2019 | 8.6 | 5.6 | 17.5 | 61.9 | 61.6 |
| 2020 | 7.8 | 4.7 | 13.5 | 59.6 | 62.8 |
In 2018, Darnold’s grade was dragged down by his completion statistics.
He actually performed quite well on a couple of metrics — throwing the ball far downfield and into tight windows. However, his 2018 completion percentage was the third-lowest in the NFL, and he had the eighth-worst differential between that percentage and what the NFL’s calculations suggested.
In 2019, he actually improved in both areas relating to his completion statistics. Unfortunately, the rest of his metrics suffered, leading to a lower grade than the season prior.
2020, meanwhile, was a complete disaster, with Darnold ranking inside the bottom 10 in IAY, CAY, AGG%, completion percentage, and the differential between his expected and actual completion percentages. It was his worst year in almost every category.
For Sam Darnold to be successful with the Panthers, many things need to change
Looking at the data, it’s not a stretch to say that Darnold hasn’t been a good quarterback over the last three years. And last season, he was truly terrible.
Simply put, I don’t know what compelled the Panthers to trade for Darnold. Whatever metric you use, there are few positives in his play.
It’s possible that a change in environment could help Darnold return to the form he showed during his first two seasons. Ideally, the 2021 Panthers will be less of a dumpster fire than the Jets were during Darnold’s time in New York.
The problem is, Darnold’s peak performances weren’t that great to begin with. For the trade to really be worth it for the Panthers, he will need to play at a level we’ve never really seen from him.
We’ll see if he can manage it.
Lucas Ellinas is a writer for Pro Football Network. You can follow him on Twitter @Lucas_Ellinas.
