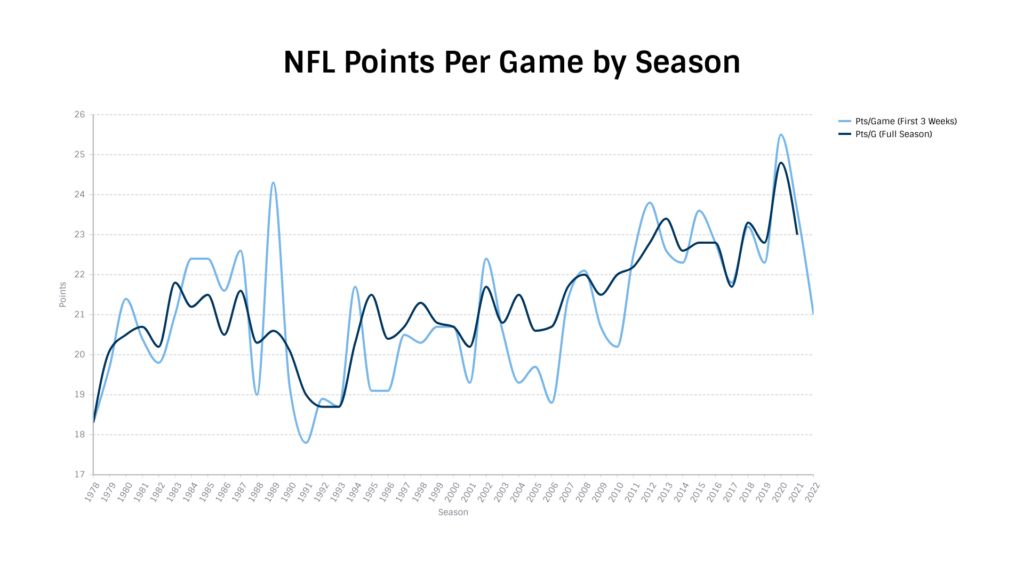
Offenses in the NFL can’t seem to score. Through three weeks of the NFL season, we’ve seen the lowest scoring rate in over a decade. At just 21.0 points per game, NFL teams are putting up as many points per game this year as they did in 2010 – just before a points explosion in 2011 that came to define the decade of football to follow.
This comes as a surprise, too. In Vegas, game-closing point totals have hit the under 63.5% of the time, the highest such rate in NFL history, according to sportsoddshistory.com, which has over/under data that goes back to 1979.
Why is NFL scoring down to start the 2022 season?
While Vegas will eventually correct and the over/under percentage will probably trend back towards 50/50, this is fairly stark. The high-scoring offenses of just two years ago – featuring the most points scored per game in NFL history – have seemingly disappeared. That season, 13.6 percent of games featured at least one team scoring 40 points – a rate that has been cut in half this year through three weeks.
While it’s possible that this is a three-week blip in an 18-week season, that’s somewhat unusual. The first three weeks tend to provide us with a reasonable view of the season historically.

Some outlier three-week stretches – like in 1989 – have seen some corrections as the season has progressed, but generally, the first three weeks can tell us a lot about the rest of the season.
It’s difficult to nail down the reason. While it might be tempting to point out that the change in NFL strategy over the years to more two-high safety looks has depressed passing numbers – something we noted may happen earlier this week – that’s not immediately obvious on face value.
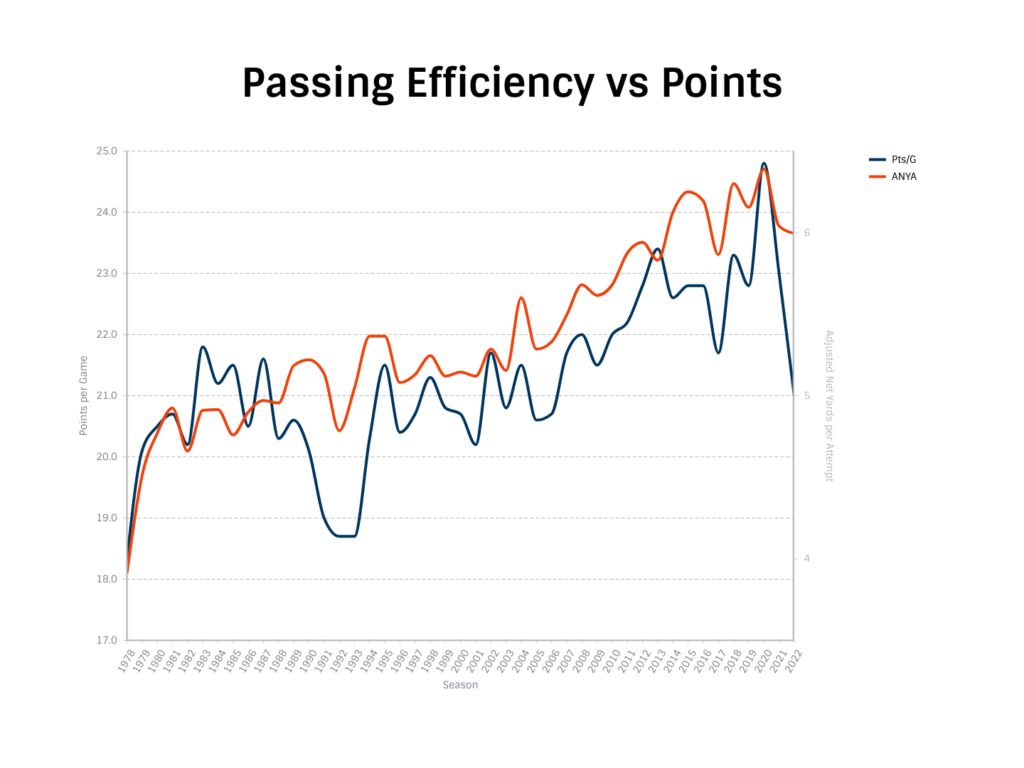
Passing yards per attempt, touchdowns per attempt, and interceptions per attempt are slightly different from 2020 but only marginally different from 2021 – touchdown rate has dropped from 4.5% to 4.3%. But interception rate has marginally dropped as well, from 2.4% to 2.3%. Net yards per attempt – which takes into account sacks – has dropped from 6.22 to 6.17 and is at its lowest rate since 2017, which was also a relatively low-scoring year.
Certainly, a dip in passing efficiency might explain some of the decrease in scoring capability, but that’s not all of it.

Perhaps teams are throwing the ball unsuccessfully on first down only to generate meaningless yards on third down – that could explain some of the differences. A quarterback who throws for six yards on first down and four yards on second down is averaging five yards an attempt and has generated a new down. Another quarterback might generate an incompletion on first down, hand off the ball for a loss on second down, and throw ten yards on third down to end up forcing a fourth-down punt, still averaging five yards an attempt.
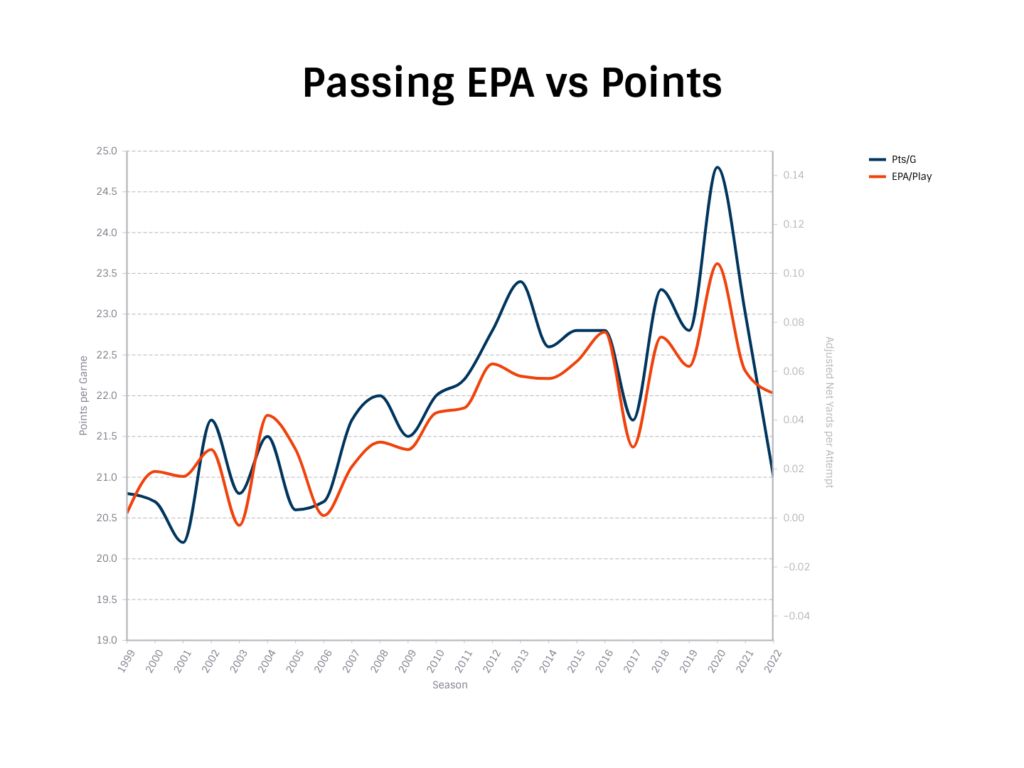
We can capture that by looking at expected points data, which accounts for down and distance. Unfortunately, we can’t go all the way back to 1978 for this data, but 1999. Still, it shows a relative dip in passing performance when accounting for contextual factors and can be mapped onto points per game.

That tracks far better. Teams are worse at throwing the ball, but box scores don’t capture it well because they are making up for it by throwing the ball slightly more often and gaining empty yards at a bit of a higher rate.
While some have expected running efficiency to go up as a result of teams selling out to defend against the pass, that hasn’t quite happened.
Yards per carry is up, but expected points per carry are down. That’s true even when eliminating fumbles, which could cause drastic dips in EPA for runs. Teams are running the ball less efficiently than they have the last two years but more efficiently than any time in the 2013-2019 period.
The decrease in passing efficiency is not uniform, however. The six most efficient quarterbacks in expected points per play in 2022 have all been more efficient than the single-most efficient quarterback in 2021, Aaron Rodgers. It just so happens that of the six least efficient passers in 2021 and 2022, five of them are from this year.
This early in the season, slicing data like that will lead to small-sample outliers that season-long numbers won’t tell us, but it is notable that the decrease in passing efficiency has not impacted the top quarterbacks, it has simply made the average and least-efficient quarterbacks worse.
There are other elements to investigate – luck-based statistics, like red zone efficiency, interception conversion rate (how often turnover-worthy plays turn into picks), fumble recovery rate, and so on might tell us a bit more.
Red zone efficiency is a bit of a dead end. Teams are converting in the red zone at about the same rate as last year and better than they did in 2019, 2018, or 2017. Instead, teams are making it to the red zone less often in the first place.
As one might expect from the fact that interception rates have hardly changed, turnover-worthy play rates have hardly changed. In fact, they’ve gone up while conversion rate has gone down, suggesting that defenses are getting worse at reeling in picks rather than better.
Also of note, drop rate among receivers has declined nearly every year and is at an all-time low, while pressure rate has about the same story. That may not be a product of quarterbacks getting rid of the ball faster, either – time to throw is around the five-year average. Depth of target is a bit lower, but it matches last year’s low depth of target.
Teams are also recovering their own fumbles more often – not less – so that kind of fluke-based explanation doesn’t work, either. Field goal and extra point percentage are also quite high and are within a tenth of a percent of the decade-long average.
What we know is that touchdown rates are down for both throwing and running the ball, but not inside the red zone. We know that teams are better at stopping pressure from getting to the quarterback and not because the quarterback is getting rid of the ball quickly. Teams are not fumbling the ball more often or recovering their own fumbles less often. Quarterbacks are throwing as many interceptions as they did before, and receivers are holding on to passes more often than they’ve ever done in NFL history.
Maybe it really is the increase in two-high coverage?
All of this suggests that the original reasoning – that teams are playing two-high coverage shells more often and forcing quarterbacks to throw shorter more often – might be one of the biggest factors in the decrease in leaguewide scoring rate.
Teams keep two safeties back, allow the quarterback to survey the field and force him to take the checkdown. That has resulted in a lower depth of completion and a lower yardage per attempt, leading to makeup yardage later that doesn’t help advance the ball in a meaningful way.
There are a few ways to check this. First is to look at first-down depth of target and yards per completion over the past several years. The second is to look at depth of target on two-high safety looks versus one-high safety looks. Finally, we can see how many yards teams have gained on third down that have not resulted in first downs and see what percentage of “empty” yards constitute a quarterback’s total production.
The first piece of intuition is correct – first-down depth of target is way down. In fact, teams make up for this on third down as they convert less often.
| Year | ADOT (1stD) | YPC (1st D) | Conv% (1stD) | ADOT (3rdD) | YPC (3rd D) | Conv% (3rdD) |
|---|---|---|---|---|---|---|
| 2013 | 8.61 | 11.28 | 32.1 | 8.83 | 10.94 | 37.3 |
| 2014 | 8.46 | 10.93 | 33.3 | 9.03 | 11.58 | 39.5 |
| 2015 | 8.63 | 11.06 | 32.2 | 9.02 | 10.85 | 37.7 |
| 2016 | 8.65 | 11.08 | 32.7 | 8.86 | 10.91 | 38.6 |
| 2017 | 8.49 | 11.02 | 32.8 | 8.82 | 10.51 | 37.5 |
| 2018 | 8.32 | 11.17 | 31.0 | 8.68 | 10.14 | 37.7 |
| 2019 | 8.13 | 11.07 | 30.0 | 9.24 | 10.94 | 38.5 |
| 2020 | 7.97 | 10.94 | 31.5 | 8.83 | 10.53 | 39.7 |
| 2021 | 7.71 | 10.48 | 29.4 | 8.97 | 10.64 | 38.2 |
| 2022 | 7.57 | 10.78 | 30.0 | 9.03 | 10.91 | 37.2 |
Depth of target on first down is the lowest it’s been in the past decade, while conversion rates are low. We’re seeing much higher depths of target on third down this year compared to the past, but still low conversion rates. This has resulted in a higher proportion of “wasted” third down yards at 4.5 percent.
| Years | Total Passing Yards | "Wasted" Yards | Wasted Pct |
|---|---|---|---|
| 2013 | 116822 | 4940 | 4.23% |
| 2014 | 111942 | 4218 | 3.77% |
| 2015 | 118275 | 4775 | 4.04% |
| 2016 | 114048 | 4911 | 4.31% |
| 2017 | 105237 | 4685 | 4.45% |
| 2018 | 116044 | 4356 | 3.75% |
| 2019 | 112482 | 4064 | 3.61% |
| 2020 | 115077 | 4111 | 3.57% |
| 2021 | 113047 | 4647 | 4.11% |
| 2022 | 23645 | 1054 | 4.46% |
We can also see two-high safety looks increasing, courtesy of Pro Football Focus. Excluded in the data are so-called “Cover-6” looks, with quarter-quarter-half coverages, which are also on the rise and follow the vein of Cover-2 despite having three deep defenders like Cover-3.
| Year | 2-High Pct | ADOT vs 2-High | ADOT vs 1-High |
|---|---|---|---|
| 2016 | 37.3% | 8.23 | 9.21 |
| 2017 | 29.7% | 8.77 | 9.61 |
| 2018 | 30.0% | 8.63 | 9.33 |
| 2019 | 32.9% | 8.54 | 9.41 |
| 2020 | 34.6% | 8.57 | 8.95 |
| 2021 | 37.1% | 8.55 | 9.10 |
| 2022 | 41.3% | 8.41 | 9.07 |
All of this tells us that we have at least one significant reason offenses aren’t scoring points: defenses are adapting. This is likely not the entirety of the reason we’ve seen fewer points – the quality of players matters on both sides of the ball, injuries play a role, and other offensive and defensive innovations or realities have a part in all of this as well.
But new trends in football appear all the time, and it seems like fans will have to be content, for now, with a little bit less scoring.

